Windows 10 is a great operating system, but it can be tricky to know what you should do when things go wrong. One of the most common problems that people experience with Windows 10 is overheating. If your CPU temperature is too high, then there are steps that you can take in order to fix this problem and keep your computer running smoothly. In this guide, we will show you how to check the CPU temperature in Windows 10, as well as 7 other ways for keeping it cool without spending any money!
Check CPU Temperature in Windows 10
What Is a Normal CPU Temperature?
While there are no specific standard numbers, it should be somewhere between 50 °C and 80 °C. Of course, the lower your CPU temp is the better for your computer health. Also, keep in mind that other components can have temperatures as well which you need to check if they’re within range too.
- The M9-S’s processor is designed to operate at a minimal temperature, as low as 30 to 50 °C (86 to 122 °F).
- Extreme heat generation: up to 95 °C (up to 203 °F)
- The temperature should not exceed 100 °C (212 °F) for a prolonged period, especially if you don’t have a way of rapidly lowering it.
By using a Throttle stop
ThrottleStop is a one-of-a-kind program developed by Kevin Glynn, a.k.a. “UncleWeb,” to counteract the three primary types of CPU throttling (thermal, power limit, and graphics processor unit) that computers have today.
It began as a simple tool to check temperatures and modify CPU clock speeds in older laptops. ThrottleStop has grown in feature-set and stability over the years, and it may be used for undervolting, “set-and-forget” temperature/clock speed profiles, benchmarking, SST tuning, and temperature monitoring. XTU was initially much simpler and more limited than ThrottleStop (formerly Extreme Tuning Utility).
Also Check: Fix Microsoft Store Not Working on Windows 10 – Tutorial
How to use the Throttle stop application?
- Download the most recent version of ThrottleStop.
- Click the “Start” button.
- Next, go to the setting menu. Then click on the app where you want to start.
- Locate the ThrottleStop program and turn it on.
- Find and open the ThrottleStop app.
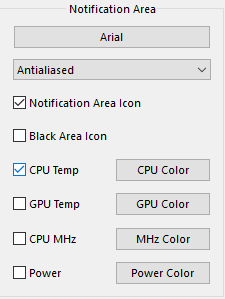
- In the bottom corner of the screen, touch “Options.”
- Under the “Notification Area” in the middle, check the box for “CPU Temp,” then click OK.
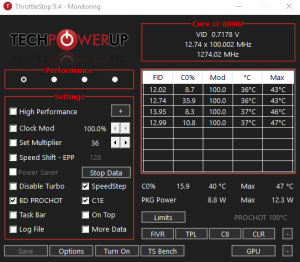
If you want to cool down your CPU, undervolting is worth considering, but it’s also beneficial as a CPU temperature monitor. The main Throttle stop window displays each core’s temperature, but you may also see your CPU temperature in the notification area on your PC.
By using HWMonitor:
HWMonitor is a free, lightweight, and easy-to-use application that shows you all the information about your CPU temperature. It integrates with Windows Task Manager, so before we open HWMonitor let’s take a look at what this app can do. You will find out more below:
You can find HWMonitor here: [HWMonitor](link-here) and it is available for Windows Vista SP or higher. We will see your CPU temperature in the tab labeled “Temperatures” along with other important statistics about your computer hardware. Which are useful to know if you have any problems. If one of these values gets too high you might have a problem with overheating so consider taking action then before things get worse!
To use this application simply download it from the link above and run it once downloaded. It is only around 350kb so opens quickly on most computers. There’s no need to install anything because all that is needed will be done when running the application itself.
How to use the HWMonitor application?
- Download the most up-to-date version of HWMonitor.
- Open the app and begin by authenticating.
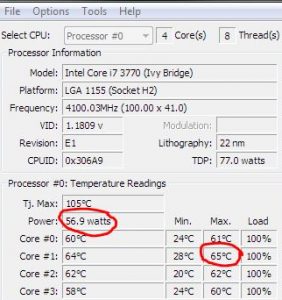
- The CPU detail screen shows all of your system’s CPU information.
- Scroll down to the “Temperatures” section in the middle.
- The present, minimum, and maximum CPU processor temperatures will be shown.
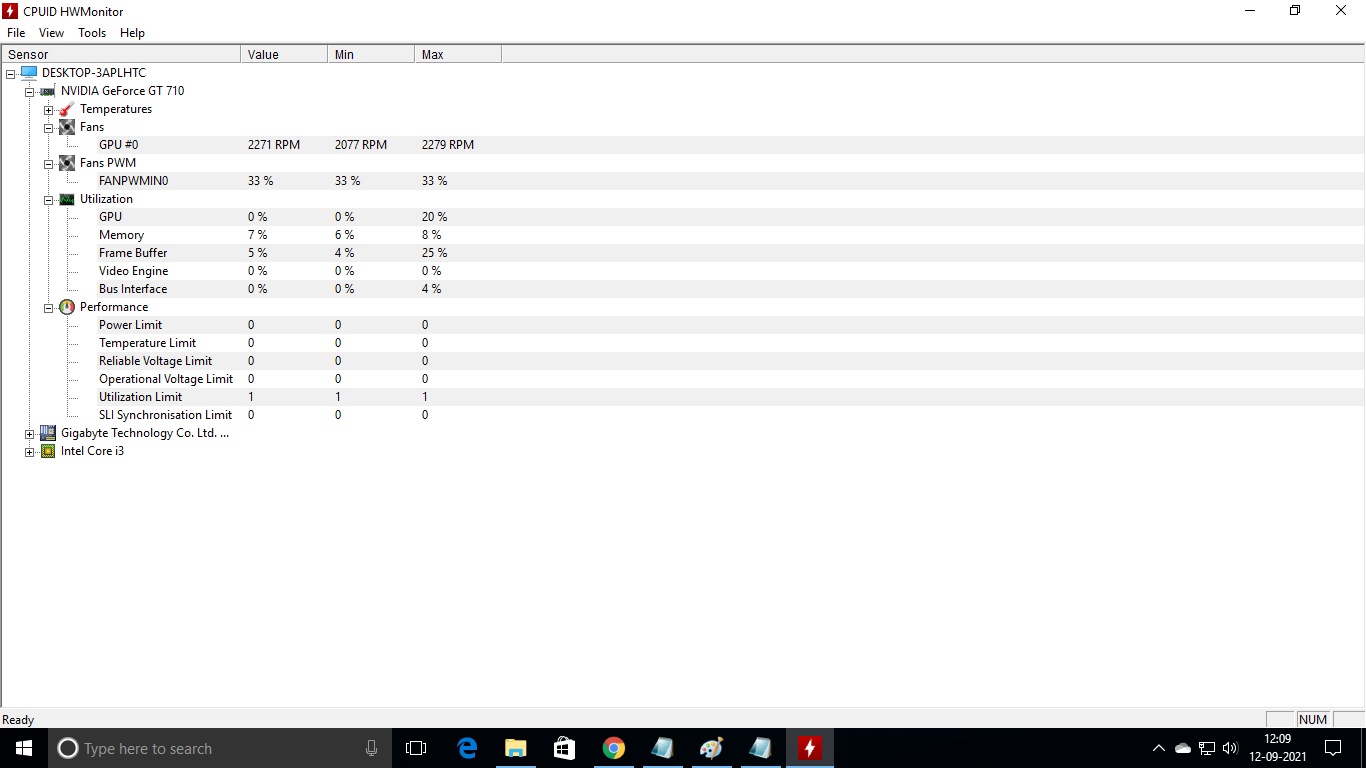
The interface will show the voltage of each core, how much CPU is being utilized, and – most crucially – the temperature of each core. It also displays the present temperature as well as the minimum and maximum temperatures.
There’s not much to go through because everything is crammed onto that one screen. You may turn on a dark mode for those late-night monitoring sessions, enable a status bar, and quickly save a log of your monitoring data with the Ctrl + S key combination.
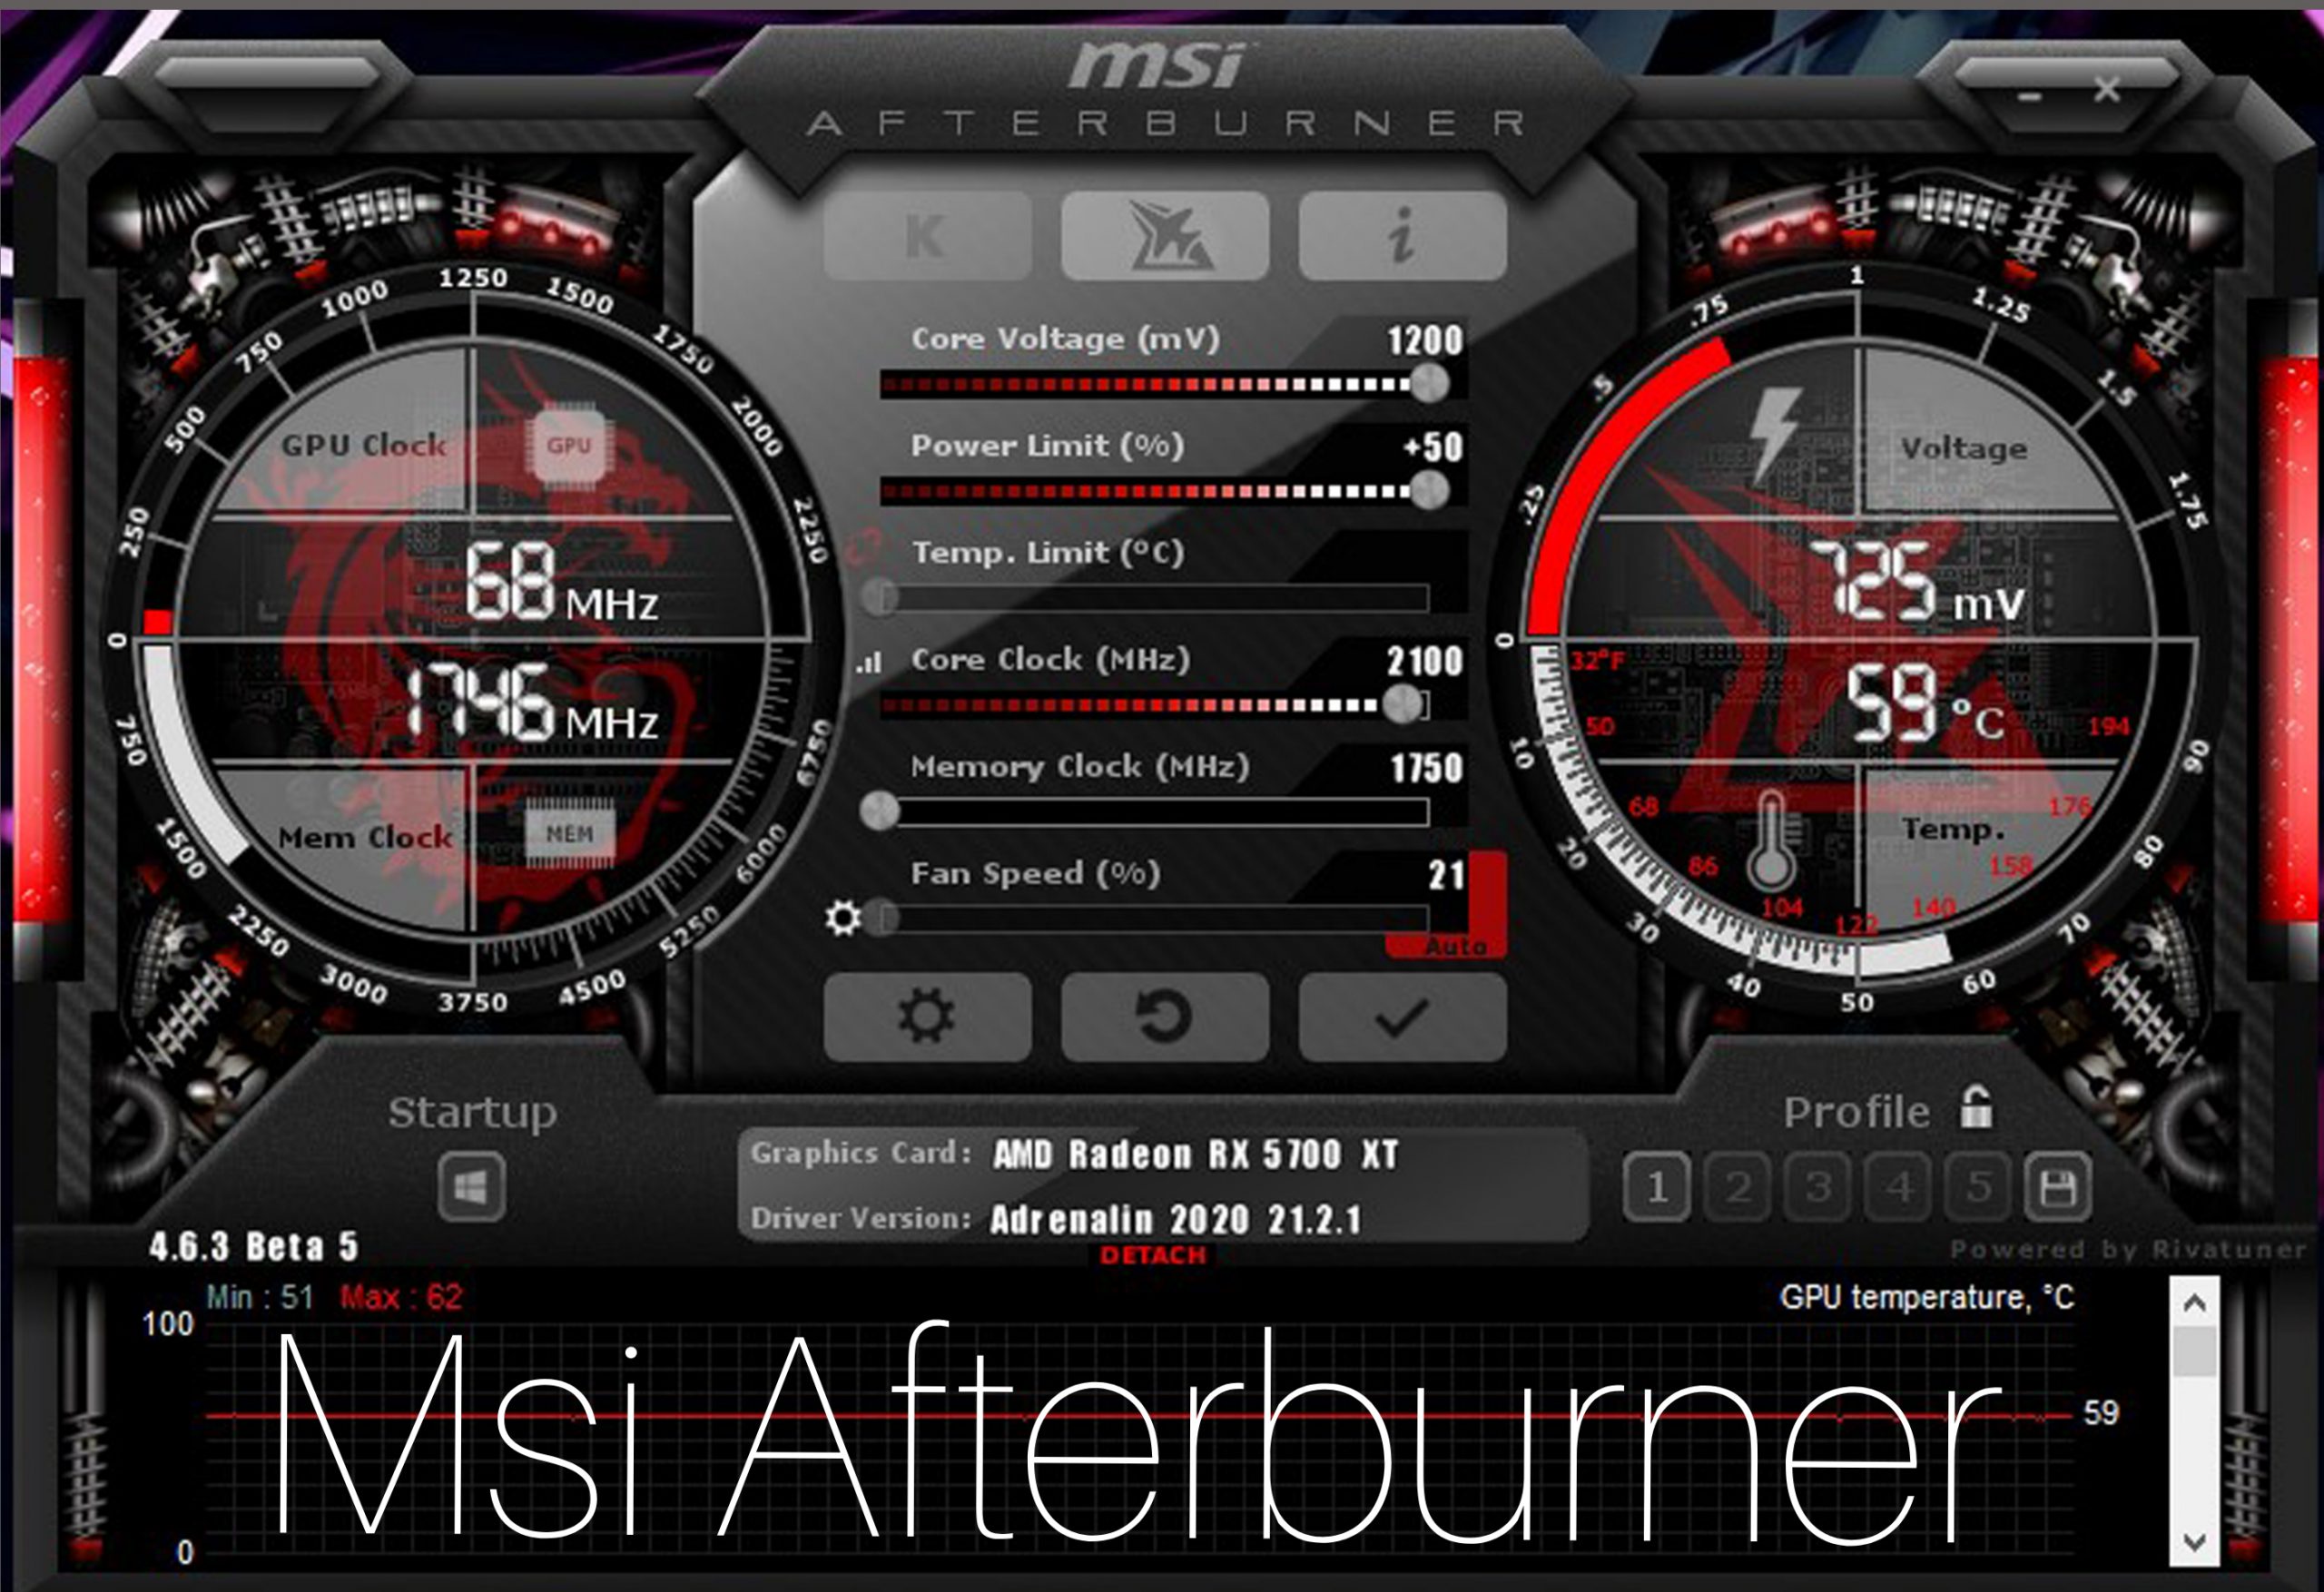
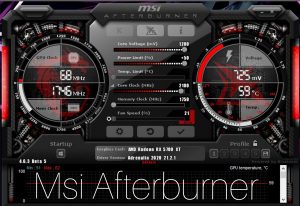
Check Temperature using MSI Afterburner
An excellent free alternative is MSI Afterburner. It is a very popular overclocking tool with an easy-to-use interface that gives you access to essential system information including the core clocks, memory clocks, and GPU voltage of your graphics card(s). You can also control the fan speed on most cards. Here are some screenshots:
- CPU Usage
- Core Clock
- Memory Clock
The best thing about this software? There’s no installation required; it’s portable, so you can run it straight from USB or even load it through Steam without having to worry about files getting deleted later on (ShadowPlay for example); there’s no need to install the latest drivers, and it’s simple.
You can download MSI Afterburner from here: [link]
Open the downloaded file, select your language of choice (there are 35 options), click on ‘I accept’ if you agree with the license agreement, then choose a destination folder for installation. Click next until you get to this window:
Click Install and there will be a few messages displayed in the bottom left panel which is normal behavior when installing software so don’t worry about that. You’ll know all is well when you see an empty black box like this one below:
Now just launch MSI Afterburner by clicking on its icon or through Steam > Library > Tools. In my opinion, MSI Afterburner looks best on dark backgrounds, so I have added a black background to the screenshot above.
If you don’t want to use MSI Afterburner. There are many other free alternative software that can monitor your CPU temperature including HWmonitor, Speed fan, etc.
How to use the MSI Afterburner application?
- Download and install the newest version of MSI Afterburner.
- Locate and launch the program.
- The CPU temperature and associated information will be displayed on the home screen.
- To get your CPU temperature graph to appear first, you need to set the option.
- Go to “Settings” and select the “Monitoring” option.
- You may also customize the home screen by selecting what you’d like to see there. Then, drag your choices into the sequence in which you want them to be displayed as graphs on the right.
- Select “OK” after dragging the CPU temperatures to where you want them.
- If you want to see the temperature on your computer screen, choose a number like 40 degrees Celsius. Then make sure that there is a check next to the box next to “show in on-screen display”. Whenever you press the shortcut for “on-screen display” it will show up in your screen corner.